

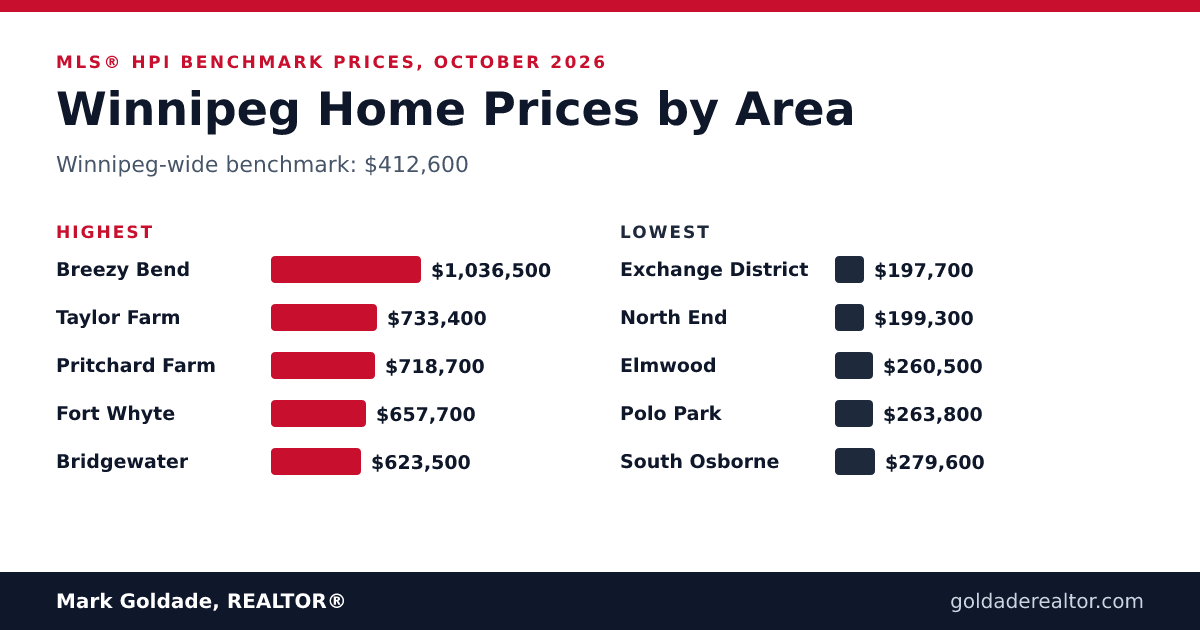
Winnipeg home prices vary far more by area than the headline number suggests. The Winnipeg-wide MLS® HPI composite benchmark price was $412,600 in October 2026, but some neighbourhoods sit under $200,000 while others are above $1,000,000. This guide breaks the October 2026 benchmarks down by neighbourhood so you can see where your budget goes furthest.
What a benchmark price is
The Home Price Index (HPI) from Winnipeg REALTORS® tracks the price of a typical home with set characteristics in each MLS® area. The benchmark price is the price of that typical composite home. It is not an average or median sale price, so it will differ from what homes actually sold for in a given month. Benchmarks are useful for comparing areas and tracking Winnipeg home prices over time.
Several neighbourhoods share one MLS® area, so neighbourhoods in the same area share the same benchmark. For example, Fort Whyte and Whyte Ridge both fall in the same area at $657,700.
Highest Winnipeg home prices by area
| Neighbourhood | Benchmark (Oct 2026) | vs. Winnipeg-wide |
|---|---|---|
| Breezy Bend | $1,036,500 | +151% |
| Taylor Farm (Headingley) | $733,400 | +78% |
| Pritchard Farm | $718,700 | +74% |
| Fort Whyte / Whyte Ridge | $657,700 | +59% |
| Bridgewater | $623,500 | +51% |
| Sage Creek | $616,500 | +49% |
| Royalwood | $609,900 | +48% |
| Amber Trails | $544,700 | +32% |
| Charleswood | $527,700 | +28% |
| Southdale | $511,000 | +24% |
Tuxedo is not in this table because its MLS® area has a limited benchmark. On the 12-month median sale price instead, Tuxedo was about $1,231,500, among the highest in the city.
Near the middle of the Winnipeg home prices range
| Neighbourhood | Benchmark (Oct 2026) | vs. Winnipeg-wide |
|---|---|---|
| Garden City | $478,400 | +16% |
| Ridgewood West | $460,200 | +12% |
| Westwood / St. Charles | $442,700 | +7% |
| River Heights | $437,500 | +6% |
| North Kildonan | $409,600 | -1% |
| Transcona | $394,800 | -4% |
| St. Vital | $370,400 | -10% |
| Fort Garry | $364,500 | -12% |
Several large areas sit close to the Winnipeg-wide figure. North Kildonan, Transcona, St. Vital and Fort Garry fall within roughly 12% of $412,600, which is why they are popular starting points for buyers comparing value and commute.
Lowest Winnipeg home prices by area
| Neighbourhood | Benchmark (Oct 2026) | vs. Winnipeg-wide |
|---|---|---|
| Exchange District | $197,700 | -52% |
| North End | $199,300 | -52% |
| Elmwood | $260,500 | -37% |
| Polo Park / Sargent Park | $263,800 | -36% |
| South Osborne | $279,600 | -32% |
| St. James / Deer Lodge | $281,000 | -32% |
| Fort Rouge | $318,400 | -23% |
| St. Norbert / Richmond Lakes | $322,000 | -22% |
| St. Boniface | $322,700 | -22% |
| Wolseley | $339,300 | -18% |
Source: Winnipeg REALTORS® MLS® Home Price Index, composite benchmark price, October 2026. Percentages compare each benchmark with the Winnipeg-wide composite of $412,600 and are rounded. Benchmarks describe a typical home in each MLS® area, not the sale price of a particular home. Osborne Village and Corydon had a 12-month median sale price of about $375,000.
Why benchmarks and sold prices differ
Do not be surprised if a benchmark looks lower than the prices you see on listings. A benchmark describes a typical home with fixed characteristics, while sold prices reflect the real mix of homes that changed hands. In Fort Garry (MLS® area 1J), for example, the October 2026 benchmark is $364,500, yet the median MLS® sale price over the past 12 months was about $485,000. In River Heights and Armstrong's Point (areas 1C and 1D), the benchmark is $437,500 against a median sale price of about $550,000.
That gap is why this guide is best used to compare areas with each other and to track Winnipeg home prices over time. When you are ready to price a specific home or set an offer, a comparative market analysis based on recent sales in your immediate area is the better tool.
What this means for buyers and sellers
- Budget shapes the map. With roughly $350,000, you are looking at areas such as Wolseley, St. Boniface and parts of the south and east. With $500,000 or more, the south and west edges open up.
- Location premiums are large. Two areas can sit $300,000 or more apart even when the commute is similar, so a short list of neighbourhoods saves time.
- Do not use a benchmark as a price. Your own home's value depends on its size, condition, lot and updates. Ask for a comparative market analysis based on recent sales.
- Watch the trend, not one month. Winnipeg REALTORS® publishes new HPI benchmarks every month, and a single reading can move with seasonal activity. Looking at several months side by side gives a better picture of whether an area is rising, flat or cooling.
- Outside the city, prices work differently. See Rural homes near Winnipeg: what detached homes sold for.
Want to know what this means for your home?
Benchmarks are a starting point for understanding Winnipeg home prices. For a value based on recent comparable sales, request a free home valuation or contact me to talk through buying in a specific area.
This article is general market information, not an appraisal or financial advice.
Related reading: Buying in Winnipeg, Selling in Winnipeg, Winnipeg real estate market segments.